Display data in groups
 Updated
by Andreas Knaupp
Updated
by Andreas Knaupp
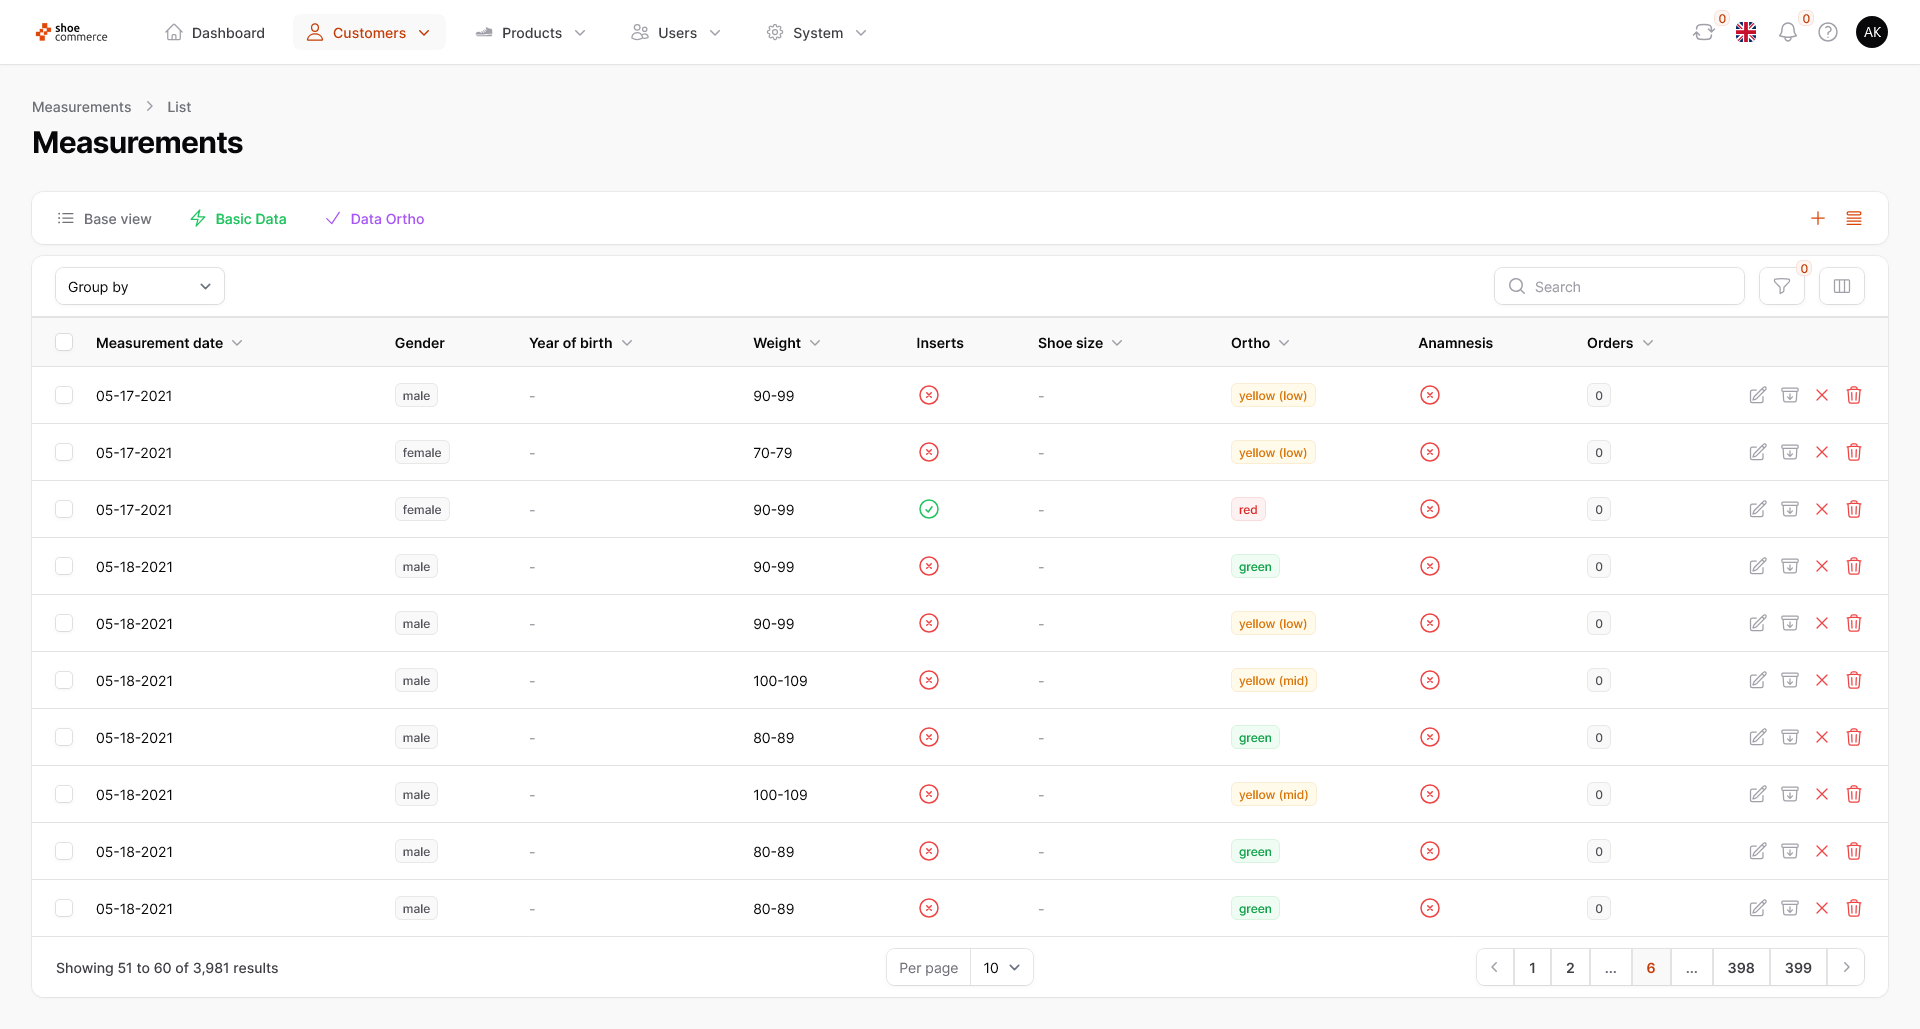
The function of displaying data in groups is explained here using the “Measurements” menu as an example, but works identically on all levels of the backend.
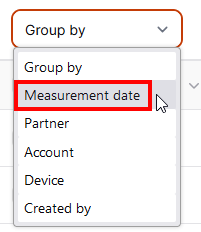
- In the list view of the backend, you have the option of displaying grouped data according to various criteria. These differ from menu to menu and are shown here as an example for the “Measurements” area. In our case, we would like to group all measurements according to a specific day. To do this, first click on the “Group by” drop-down menu, which will open a new menu. Now select “Measurement date” or another criterion by which you would like to group.

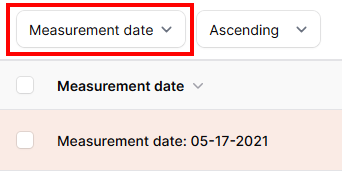
- In the list view, all details of dates are now grouped together and also highlighted in color. You also have the option of sorting in ascending or descending order according to the selected criterion.

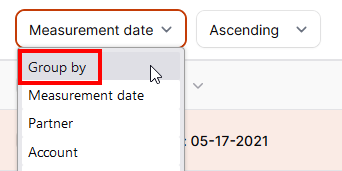
- To remove this grouping, please click on the grouping option again (in our case “Measurement date”) to open the drop-down menu. Here, please click on “Group by”, which will deactivate the grouping function.